The Export Order Flow
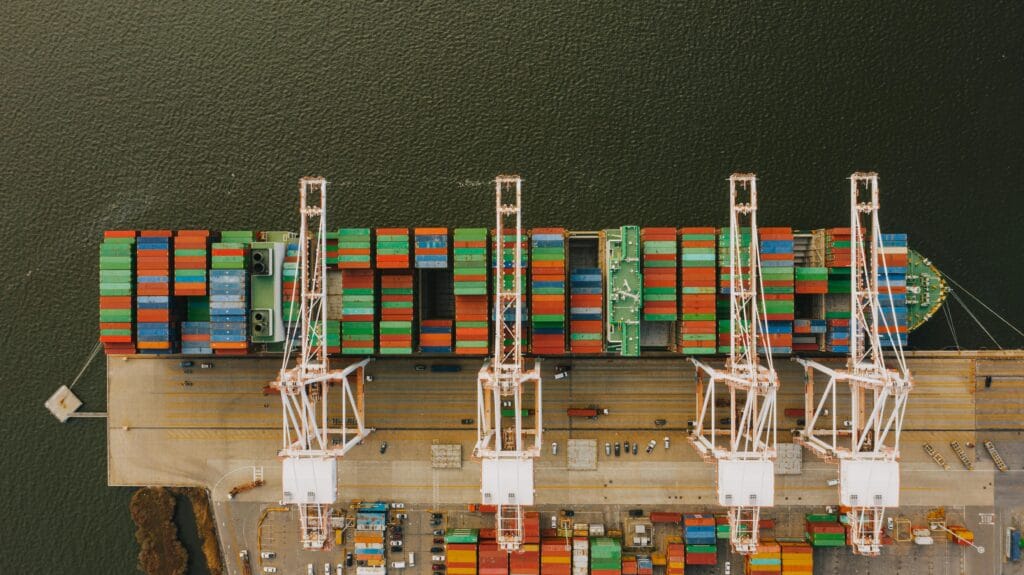
Infographics Logistics & Supply Chain The Export Order Flow A step-by-step guide to the manufacturing journey, from start to shipment. Export Manufacturing Workflow Stage 1 Order Confirmation This is the “go” button. You and the buyer finalize the product specs, quantity, price, and—most importantly—the shipping deadline. Key Checkpoint: Everything flows from this. A clear, […]
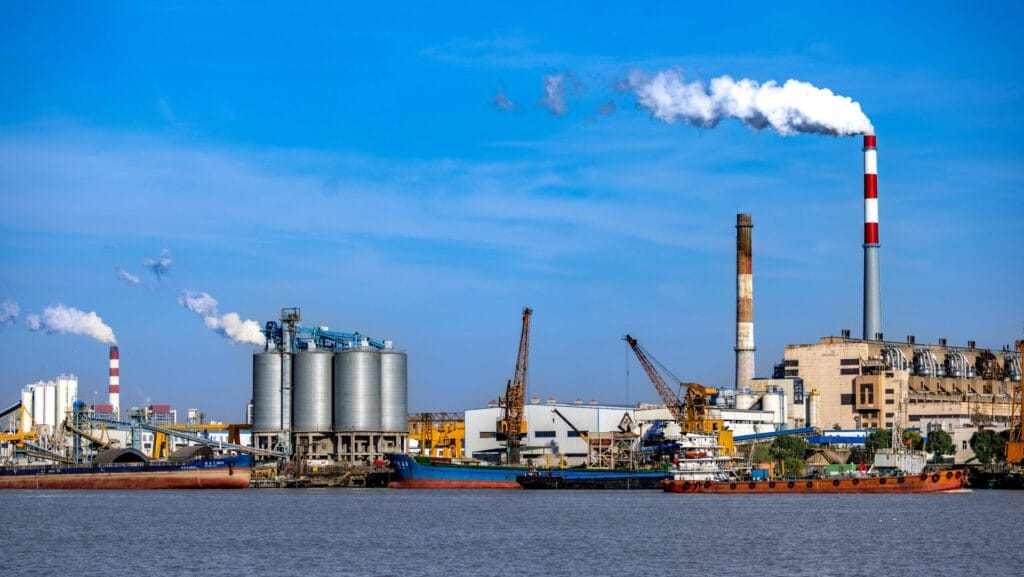
Vietnam’s Craft Revolution
Consumer Goods Infographics Vietnam’s Craft Revolution The fire in Bat Trang village has burned for 700 years. For centuries, the village’s identity was a plume of black smoke from coal-fired kilns—a signal of life, but also a source of illness. Today, the air is clean. The Soul in the Supply Chain: Vietnam’s Craft Revolution The […]
Vietnam: A Textile-to-Garment Giant

Apparel & Textile Infographics Vietnam: A Textile-to-Garment Giant Exploring the “Downstream” Powerhouse and its “Upstream” Bottlenecks Vietnam’s Textile & Garment Flow A Global Leader in Garment Assembly Vietnam is one of the world’s largest and most important hubs for garment manufacturing, ranking as the second or third-largest textile and apparel exporter globally. The “Made in […]
Vietnam Supplier Tier Mapping
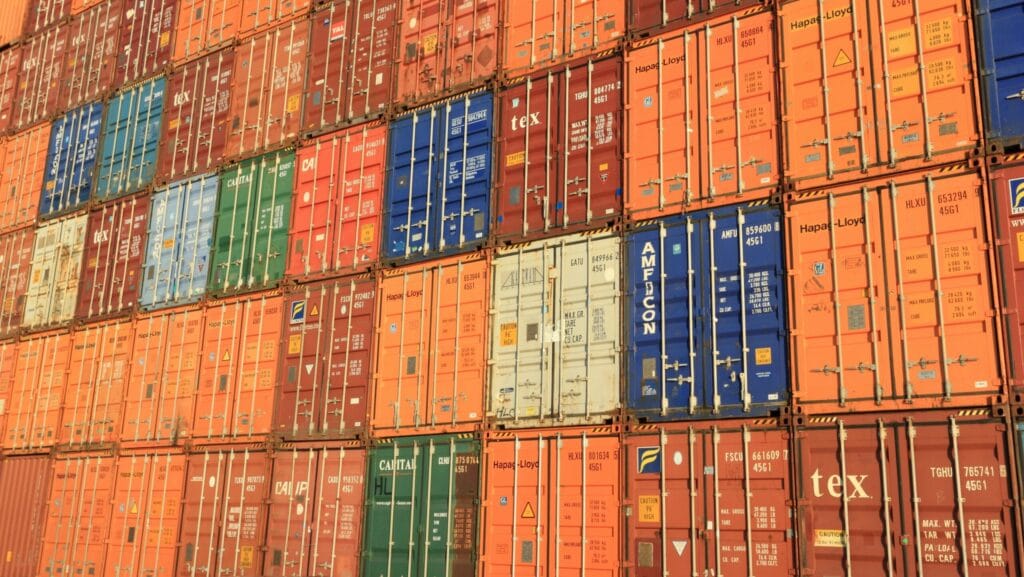
Infographics Logistics & Supply Chain Vietnam Supplier Tier Mapping Tiers 1, 2, & 3 in the Manufacturing Landscape Vietnam Supplier Tier Mapping What Are Supply Tiers? Tier 1 Direct Suppliers to OEMs. These companies assemble and provide major components or systems (like a car’s seating system or an electronic mainboard) directly to the final […]
Understanding the OEM, ODM, and OBM Models
Infographics Logistics & Supply Chain Understanding the OEM, ODM, and OBM Models While OBMs represent established brands, a vast majority of global trade, especially in electronics and consumer goods, flows through ODM and OEM partnerships. Trade Talk: Understanding OEM, ODM, OBM Models How the Market is Segmented The global manufacturing landscape is dominated by these […]
Coffee, Cocoa & Specialty Agricultural Products

Agriculture Infographics Coffee, Cocoa & Specialty Agricultural Products The coffee and cocoa sectors are navigating a period of extraordinary volatility. Forecasts for the 2025/2026 season indicate a substantial rebound in production for both commodities. Sector Spotlight: Coffee, Cocoa & Specialty Ag Executive Summary The coffee and cocoa sectors are navigating a period of extraordinary volatility. […]
Vietnam’s FTA Impact Map

Infographics Vietnam Market & FDI Vietnam’s FTA Impact Map Beyond Low Cost: Mapping the New ‘Network Access’ Strategy Market Insight: Vietnam’s FTA Impact Map Vietnam has successfully positioned itself as one of the world’s most critical manufacturing and export hubs. While low costs laid the foundation, its ascent is now turbocharged by an extensive network […]
The “China + 1” Advantage

Infographics Vietnam Market & FDI The “China + 1” Advantage How Multinationals are Reconfiguring Supply Chains to Vietnam Trade With Viet – The China + 1 Advantage A Strategy of Resilience, Not Retreat The “China + 1” strategy is a global business approach to risk mitigation. Instead of a complete “China exit,” corporations are diversifying […]
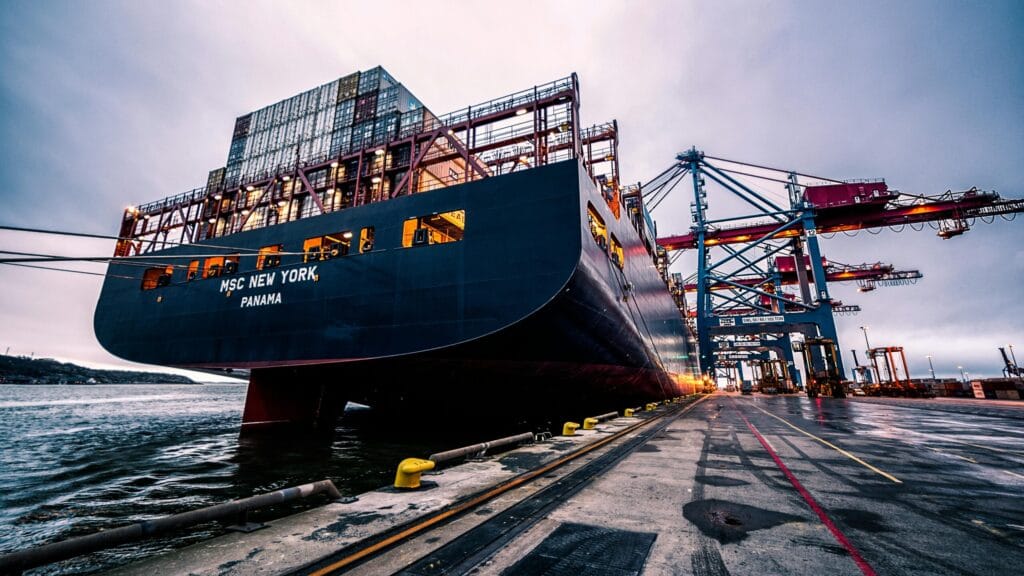
Vietnam’s Logistics Revolution
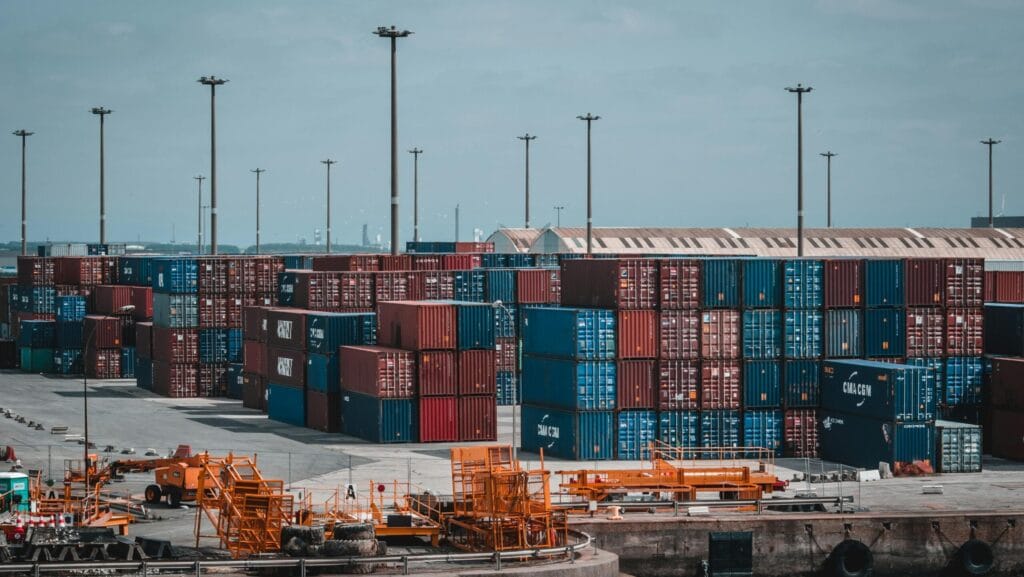
Infographics Logistics & Supply Chain Vietnam’s Logistics Revolution Forging a New Hub for ASEAN and China Vietnam’s Logistics Revolution $80B+ Total Infrastructure Ambition (2021-2030) 3,000 km National Expressway Target by 2025 1,435 mm New Standard Gauge for China-Rail Connectivity The Grand Strategy: A Trimodal Nexus Vietnam is executing a national master plan to become Asia’s […]
Visualizing the End-to-End Manufacturing Workflow

Infographics Logistics & Supply Chain Visualizing the End-to-End Manufacturing Workflow From customer order to final shipment, see how data and process flow together. Process View 6 Clusters Order → Ship System Backbone ERP + WMS Real-time data flow Quality Gate UD Required Release to sellable stock End-to-End Manufacturing Flow 📊 1. Order-to-Planning Sales Order Entry […]